Kjell-Magne Øierud
Leadership and Software Development Geek
Drawing graphs with Ruby, GTK, Cairo, and Graphviz 20 Oct 2008
Recently I wrote a prototype where I needed a quick solution for automatically laying out and drawing undirected graphs. The prototype was written in Ruby using GTK for the GUI.
I post here a small program which illustrates the basics on how this can be done, with a hope that it might be useful to others. To save some cut n’ paste, you can download the source file from this gist.
Here is a sneak peek on the result.
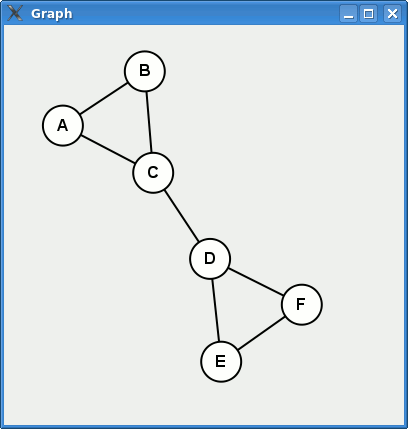
First we need a simple example graph to work with. Let us define a graph as an array of edges. Each edge is an array with two vertices, represented by symbols.
#!/usr/bin/env ruby -w

edges = [[:a, :b],
         [:a, :c],
         [:b, :c],
         [:c, :d],
         [:d, :e],
         [:d, :f],
         [:e, :f],
        ]
The next thing is to calculate a layout of the vertices. To do this I use the neato command from Graphviz. Neato is a program for drawing undirected graphs. Graphviz expects its input to be in the dot language.
dot = "graph Test {\n"
edges.each do |edge|
  dot << "    #{edge[0].to_s} -- #{edge[1].to_s};\n"
end
dot << "}\n"
EOT
Interaction with neato is done using a pipe, and giving it the
argument -Tplain produces a graph to stdout with layout
information. The output format is described here.
layout = IO.popen('neato -Tplain', 'r+') do |pipe|
  pipe.write(dot)
  pipe.close_write
  pipe.read
end
Before we proceed, we need to define some variables. Their use should be fairly obvious later on.
vertex_coordinates = {}
padding            = 20
scale              = 100
Now we can parse the layout information.
layout.each do |line|
  if line =~ /^node (\w+)  ([\d.]+) ([\d.]+)/
    vertex_coordinates[$1.to_sym] = [$2.to_f * scale + padding,
                                     $3.to_f * scale + padding]
  end
end
Then we create a window to put the drawing inside, using the gtk2 library.
require 'gtk2'

window = Gtk::Window.new('Graph')
window.set_default_size(400, 400)

window.signal_connect('destroy') do
  Gtk.main_quit
end
And here is the code which draws the graph. The code uses the Cairo vector drawing library in a GTK::DrawingArea.
area = Gtk::DrawingArea.new
area.signal_connect('expose_event') do
  context = area.window.create_cairo_context

  # Draw the edges as straight lines between the centers of the
  # vertices.
  edges.each do |edge|
    context.move_to(*vertex_coordinates[edge[0]])
    context.line_to(*vertex_coordinates[edge[1]])
    context.stroke
  end

  vertex_coordinates.each do |v, c|
    # Draw the vertex as a circle filled with white (this hides
    # the edges underneath)
    context.arc(c[0], c[1], 20, 0, 2.0 * Math::PI)
    context.set_source_rgb(1, 1, 1)
    context.fill_preserve()
    context.set_source_rgb(0, 0, 0)
    context.stroke

    # Draw the vertex labels
    context.set_font_size(16)
    context.select_font_face('Arial', 'normal', 'bold');
    context.move_to(c[0] - 6, c[1] + 5)
    context.show_text(v.to_s.upcase)
    context.stroke
  end
end
Finally we add the drawing to the window and start the application.
window.add(area)
window.show_all

Gtk.main
THE END